AGR Map
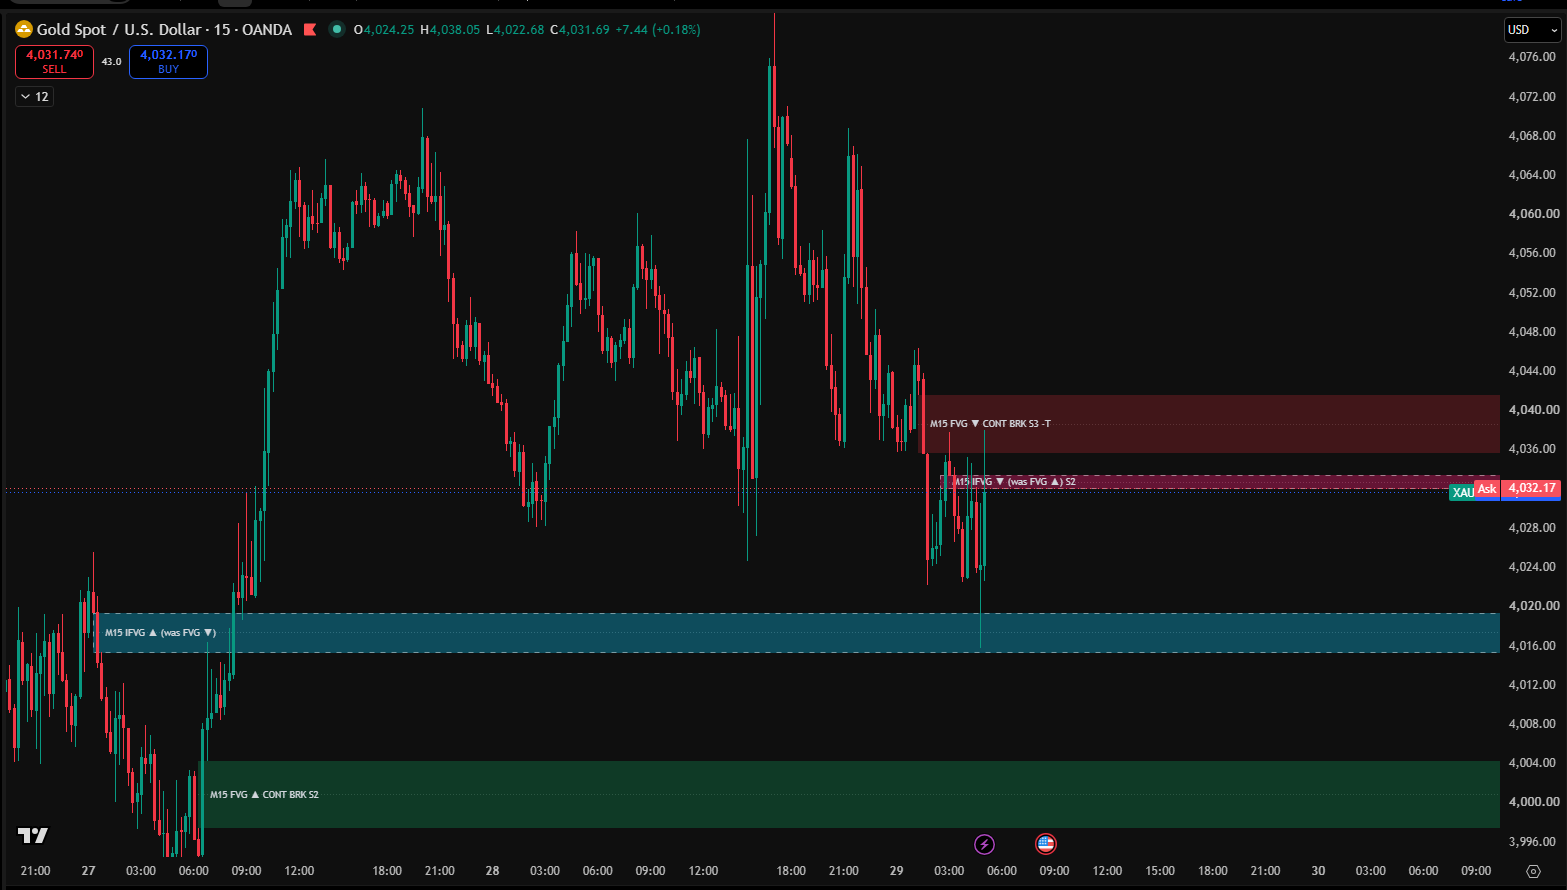
Every Fair Value Gap on your chart, tracked from the moment it forms until it is filled, inverted or expires. Display only: no signals, no alerts.
EDUCATION · TRADINGVIEWبا واقعیت معامله کن، نه با رویا.
ابزارهایی بر پایهی قاعده برای TradingView و MetaTrader. هر قاعده را روی دادهی دقیقهای آزمون کردهایم، هزینهها را از نتیجه کم کردهایم، و سالهای زیانده را هم نشان دادهایم.
همهی عددهای زیر از شبیهسازی روی دادهی دقیقهای XAUUSD به دست آمدهاند و هزینهی اسپرد از آنها کسر شده است. R واحد ریسک هر معامله است.
نتیجهی اصلی، پیکربندی زندهی KBI در یازده سال (۲۰۱۶ تا ۲۰۲۶) است: ۱٬۸۲۵ سیگنال، +۱۸۸.۷R، میانگین +۰.۱۰۳R برای هر سیگنال و شاخص t برابر ۱.۱۹. بزرگترین افت این دوره ۱۵۱R بوده است. سالهای ۲۰۱۶ (−۵۰R) و ۲۰۲۱ (−۸۰R) زیانده بودهاند و در نمودار هم دیده میشوند.
آزمون ۲۰۰۸ تا ۲۰۱۱ یکبار و با قواعد ثابت اجرا شد: ۷۰۴ سیگنال، +۸۴.۰R، میانگین +۰.۱۱۹R و شاخص t برابر ۰.۸۶. نتیجه روی چهار سال دیدهنشده در همهی اسپردهای آزمونشده مثبت بود. با شاخص t برابر ۰.۸۶، این عدد برای اثبات آماری کافی نیست؛ فقط نتیجهی اصلی را تقویت میکند و جای آن را نمیگیرد.
ابتدا یک دورهی مقدماتی (Forex and Trading Mechanics) و پس از آن دورههای Core و Advanced در ساختار بازار. تدریس بهصورت آنلاین هم برای دانشجویان و داوطلبان خارج از تورنتو و کانادا برگزار میشود. زبان دوره، شکل برگزاری، تعداد جلسات و زمانبندی را از طریق واتساپ بپرس.
معاملهی طلا (XAUUSD)، فارکس و ابزارهای اهرمی ریسک بالایی دارند و برای همه مناسب نیستند. ممکن است بخشی یا تمام سرمایهات را از دست بدهی. نتایج گذشته و شبیهسازیها تضمینی برای آینده نیستند. فقط با پولی معامله کن که از دست دادنش برایت قابل تحمل باشد.
واتساپ: +1 647 234 6091 · ایمیل: khachikbabaians@gmail.com
Trade with the truth, not with the dream.
Rule-based tools for TradingView and MetaTrader, tested minute by minute with costs deducted, and with the losing months shown.
Indicators show the market. Engine checks the context. The Executor carries out your rules in MetaTrader.
Price action tells you what happened. Market structure tells you why. Risk engineering keeps you in the game long enough for skill to matter. AI speeds up review and never makes the decision.
Swings, trends, ranges and transitions, marked with one objective ruleset, so two people marking the same chart get the same answer.
R-multiples, expectancy, sizing from stop distance and drawdown limits, written as policy.
Written rules beat willpower. Checklists, friction and a journal that makes reviews teach something.
AI summarizes your journal and surfaces patterns in your own data. The human stays the decision-maker.
Each tool does one job. Some teach, some alert, some execute. None of them promises a result.
Something new is under study. Stay tuned.
Every Fair Value Gap on your chart, tracked from the moment it forms until it is filled, inverted or expires. Display only: no signals, no alerts.
EDUCATION · TRADINGVIEW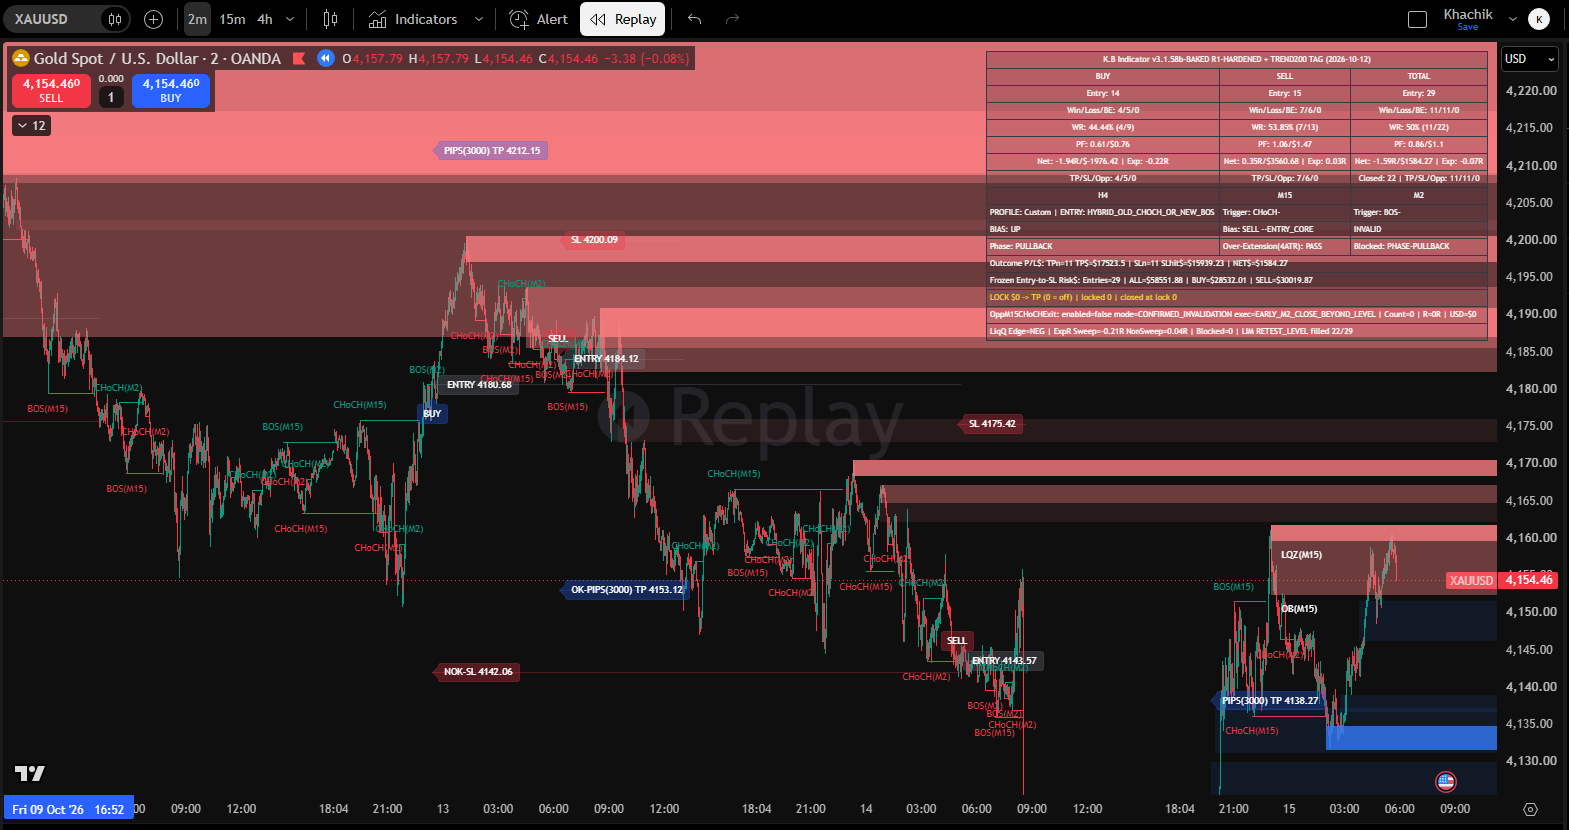
The indicator's own table for a short replay window. It is not a summary of the system's results.
A rule-based signal generator for gold. It reads top-down structure across three timeframes and produces buy and sell signals. The full conditions are shared on request. Its results are in the evidence section.
GOLD ONLY · XAUUSD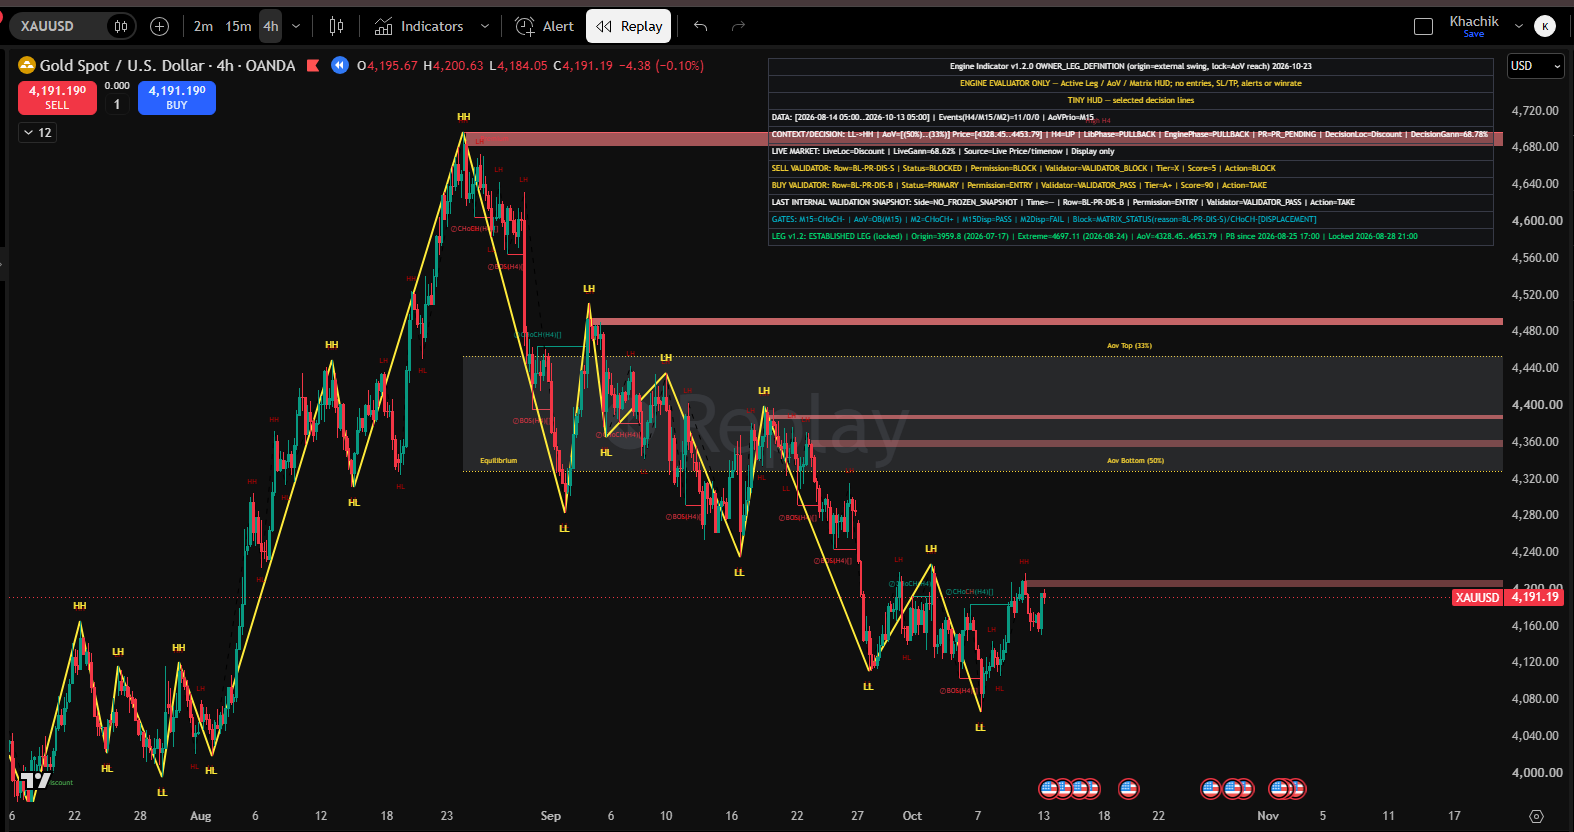
A context validator that never trades. It gives each BUY and each SELL a verdict of PASS, WAIT or BLOCK, from a 28-state matrix built on the 4-hour picture.
VALIDATOR · TRADINGVIEW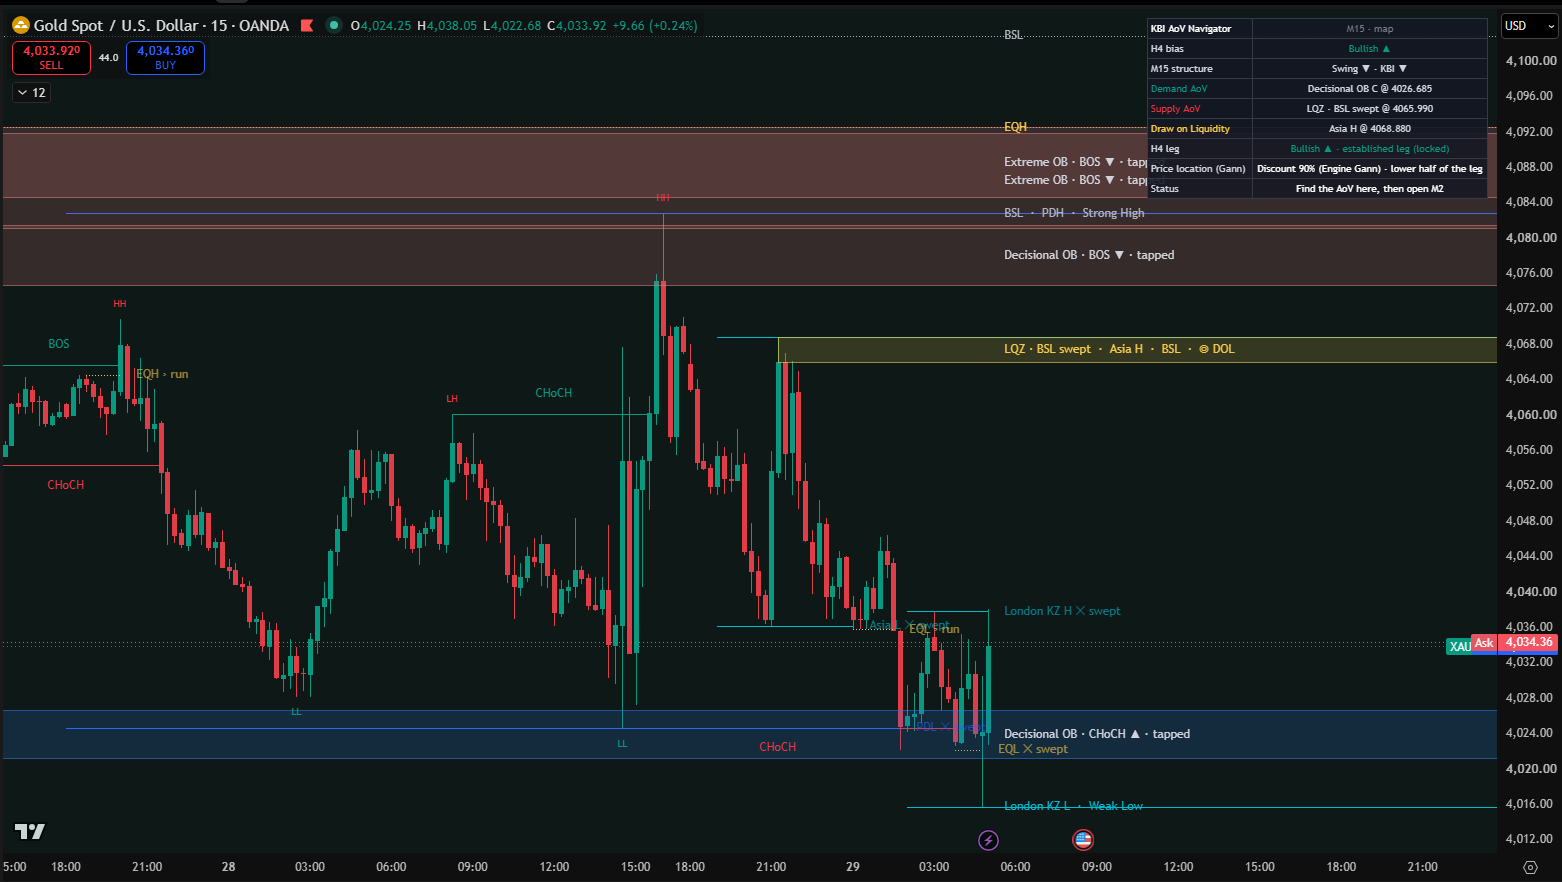
Shows the Area of Value on the 15-minute chart with the structure around it: order blocks, liquidity (previous day and week highs and lows, equal highs and lows, session highs and lows, and resting liquidity at swings), structure breaks, and Premium and Discount. On the 2-minute chart it refines the 15-minute area. Display only: no orders, no signals, no EA link.
EDUCATION · TRADINGVIEW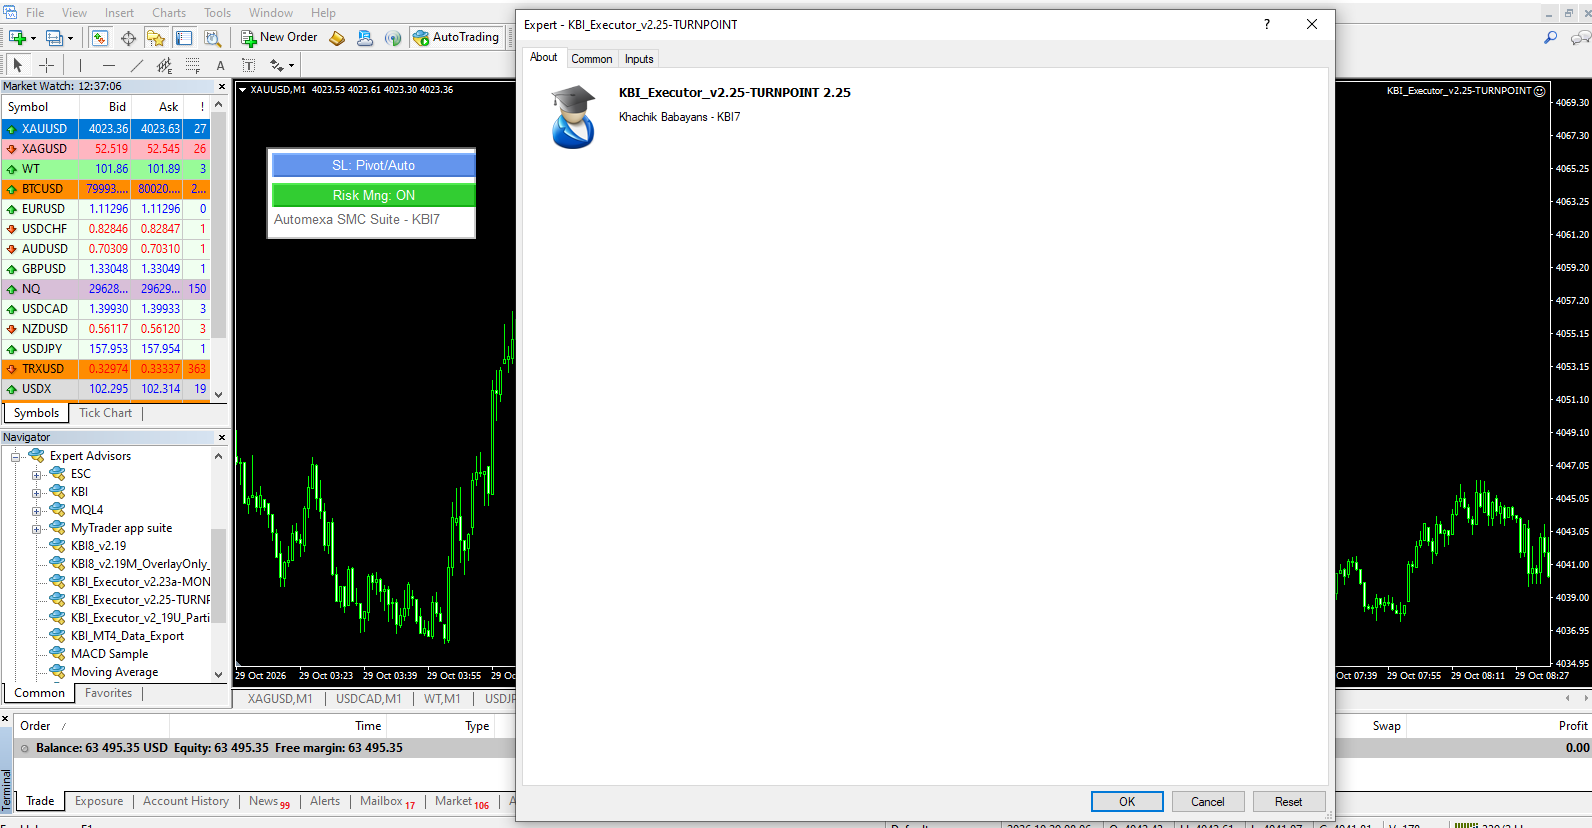
Expert Advisors for MetaTrader 4 and MetaTrader 5 that carry out signals and manage each trade. Risk and exit rules run here, because positions open and close in MetaTrader, and they cover what TradingView cannot express. The settings are detailed, so you can apply the risk and exit method you prefer. Prop-firm editions are available.
KBI Signal Executer on MQL5 Market
EA · MT4 · MT5Further tools are under study and review. Message us to hear about them first.
STAY TUNEDWant the full details of any tool, the conditions it works under, or how to use it in your own setup? Message us and we will answer each question.
One number decides whether a method deserves more testing: its average result per trade, in R, after costs.
40% of trades win +2R. 60% lose −1R.
0.8 − 0.6 = +0.2R per trade, before costs
With 0.1R of costs, the net edge is +0.1R per trade.
Every number here is a simulation on one-minute gold data, with spread deducted. Commission, swap and news slippage are only partly modelled. The losing years are in the chart too, so you can see the whole picture at a glance.
The main result is the live configuration, tested over eleven years and then, with the rules frozen, on four years it had never seen. Earlier tests with other settings sit further down. If you want the full report with every trade breakdown, message us and we will send it.
The method is written up in a working paper: Is There Timing in Smart Money? A Pre-Registered Decomposition of Structure-Based Intraday Trading Returns (SSRN).
Last updated 30 October 2026
KBI · LIVE CONFIGURATION
Net result per year after costs, in R (one R is the risk of one signal). 2008 to 2011 were run once with frozen rules, on data never used before. 2012 to 2015 is shown as one bar (four years, fixed $0.385 cost). *2026 runs to September. Losing years are shown: 2016, 2017, 2021 and 2023.
Gold, January 2016 to September 2026. The configuration now running on the demo account: KBI entries, a 200-day trend filter and a 40-day turning-point filter, and two exits per signal (an ATR-based target and a fixed target). Each year's measured spread and overnight financing are deducted.
Win rate 23.7%, profit factor 1.12. The worst year, 2021, lost 80R, and 2016 lost 50R. The best, 2025, gained 102R. At 2026 cost levels for every year, the net is +217.6R. The entry timing adds little: random entries with the same filters, stops and targets did about as well as KBI's exact entries, so the value lies in the structure, the trend filters and the exits.
The settings above were chosen with 2012 to 2026 data in view. So the frozen configuration was run once on 2008 to 2011, a period the system had never seen. The method and the decision rule were written down on 29 October 2026 and were not changed after the run.
The result per signal is about the same as in 2016 to 2026. It stayed positive under every spread assumption tested, from +0.135R at 9 points to +0.058R at 33 points. 2008 was close to zero, and most of the gain came from 2009. Most signals were buys in a rising market.
An earlier attempt on the same data was stopped before it produced any result. The completed run is the only one whose numbers were seen.
The result was positive on four years the system had never seen, at every spread tested. With a t-statistic of 0.86, four years are not enough for statistical proof, so it supports the main result rather than replacing it.
Net result per signal after costs, live configuration. No period of four years or more was negative. Across 2008 to 2026: about 3,140 signals and +289R, or +0.092R per signal.
* 2012 to 2015 was computed with a fixed $0.385 cost per trade. 2016 to 2026 uses each year's measured spread, and 2008 to 2011 assumes a 14-point spread, the 2016 level, because no spread record exists for those years.
The historical results above come from a Python re-implementation of the KBI rules, run on one-minute Dukascopy gold data. The real indicator runs on TradingView on a different price feed. We checked how closely the two agree.
Over about ten and a half months of live alerts (December 2025 to October 2026), the model produces the same kind of signals as the real indicator. The rate, the buy and sell mix and the stop size are similar, and no statistically significant difference was found in the results under the same exit rules (KS p = 0.30). An earlier check of a previous version found 67% of real gold signals on the same bar, and 78% within five bars.
It is not a trade-by-trade copy. Because the price feeds differ, and because the live indicator changed versions during that window, only a small share of individual signals line up to the minute: about 5% have a model signal within ten minutes. Where the live and modelled versions were the same, 4 of 11 real signals (36%) fell on the same two-minute bar. The check can only detect differences of about 0.15R per signal or more. So it supports the historical numbers as a description of how KBI behaves, not as a record of the exact trades it would have taken.
A pre-registered study of where these returns come from. Each KBI signal was paired with random entries that share its side, stop, target and costs. The finding: KBI's exact entry moment adds no measurable value over those random entries. What carries the result is the trend filter and the exit rules, with KBI setting where the stop goes and how often a trade is taken. The paper makes no profitability claim, and it is being revised after the first journal reviews.
These use different settings from the live configuration above, so they are separate results, not one system.
Cumulative net R by month, October 2024 to September 2026. The KBI line is the earlier two-year configuration described below.
Gold, October 2024 to September 2026. Retest-limit entry with a volume-profile target, one position at a time.
t-statistic 2.44 for this setting. This is a different configuration from the eleven-year live configuration, so the two sets of numbers should not be read as one system. Two years in one market is a short history: promising, not proven.
Two passed FTMO challenges, traded with the KBI signal generator and the Engine signal validator, according to the owner. Certificates dated 18 December 2025 and 4 February 2026.
A challenge is a simulated account with profit and loss limits, not a live-money record. The certificates do not show trade-level results. FTMO is a separate company, and this site is not affiliated with it.
No product here guarantees income. The results above are simulations on historical data, produced by a Python model of the rules. Before the 2008 to 2011 test, the same model was checked against a known 2012 to 2015 result and matched within the tolerance set in advance. The live forward test will decide.
Questions about a test, its window, or its costs? Message us and we will walk you through the numbers.
Two tracks: the market structure courses, and AI for business. Classes run in Toronto and online, including for students outside Toronto and Canada. Course content, number of sessions and schedule are shared directly, so message us for the details.
The method behind the tools: reading market structure, liquidity, and how to turn an idea into written rules. The foundation course comes first, then Core, then Advanced.
Foundation: Forex and Trading Mechanics. Core and Advanced: professional courses with practical workshops.
One-to-one work on your own charts and rules.
A small group on the same material.
Scheduled cohorts. Message us for the schedule.
Building AI agents, automating workflows with n8n, and using AI in everyday business operations. Taught by an instructor who builds these systems.

Khachik Babayans has taught financial markets and applied AI in business at a college in Toronto. He builds the Automexa tools. Each idea is written as a rule, tested minute by minute with costs, and then left to a forward test whose verdict is set in advance.
That is why the losing periods are on this site. A tool you cannot check is a tool you cannot trust.
Tell us who you are and what you are working on. We review every application. When a group is ready, we invite its members to a live demo of the KBI tools on real charts.
Your application goes directly to our WhatsApp. We do not store it on this page. Your details are used only to arrange the demo session.
For general questions and course enquiries. For a demo session, use the application above.
The terms that apply to this site, its content and its tools.
By using this site you agree to these terms. The site provides educational material, descriptions of software tools and published test results. Nothing on this site is financial, investment, legal or tax advice, and nothing here is an offer to buy or sell any security or to manage money. You are responsible for your own decisions, and for checking any tool, rule or result before you use it.
The text, images, charts and software descriptions are protected by copyright and trademark law. They may not be copied, resold or redistributed without written permission. TradingView, MetaTrader, MQL5 and FTMO are trademarks of their owners. This site is not affiliated with them unless stated otherwise.
The site is provided as is, without warranty. To the extent the law allows, the owner is not liable for losses arising from the use of the site or its tools. These terms are governed by the laws of Ontario and the federal laws of Canada that apply there.
We collect only what you send us. That means the details you enter in the demo application or the contact form, and the messages you send us on WhatsApp. The demo application is sent to our WhatsApp when you press send, and this page does not store it. The contact form is hosted by Google Forms and is subject to Google's privacy policy.
We use your details only to reply to you, to arrange a demo session, or to send the course information you asked for. We do not sell personal information. We keep your details only as long as they are needed for these purposes. You can ask us to delete them at any time through WhatsApp. We have not added advertising or analytics tracking to this page.
No payment is taken on this site. Course fees, where they apply, are agreed in writing before enrolment, and the refund conditions are stated in that agreement. Tools sold through third-party marketplaces, such as the MQL5 Market, follow that marketplace's refund rules.
If you have a question about a payment, message us on WhatsApp before you pay.
Trading gold (XAUUSD), forex and other leveraged instruments carries a substantial risk of loss and is not suitable for everyone. You can lose some or all of the capital you put at risk, and leverage can magnify losses. Past and simulated results do not guarantee future results.
Simulations assume the costs shown on each card. They cannot reproduce every real-market condition, such as slippage, price gaps, broker execution or news. Automated tools can fail or behave differently from their tests, for example after an update, a broker change or a connection problem. Only trade money you can afford to lose, and get your own professional advice where you need it.